Architecture
WebMonitor is a service run by Senceive on the Microsoft Azure cloud platform.
The WebMonitor System consists of three major components: an Azure SQL Database which stores all configuration, data samples and diagnostic information for all sites; the web front end which is built on the enterprise-grade Microsoft ASP.NET platform; and a Virtual Machine running the WebMonitor Service. The WebMonitor Service is responsible for all background tasks, including:
-
Managing incoming sample and diagnostic data from field equipment
-
Processing incoming data samples and images
-
converting to engineering units
-
applying any configured baseline offsets
-
applying any configured data filtering
-
Performing virtual sensor calculations (derived sensors, aggregate sensors and sensor chains)
-
Alerting on data samples
-
Alerting on network health
-
Maintaining FlatMesh Nodes’ network intelligence configuration
-
Periodically uploading data to external servers over FTP/FTPS
Data Alerting
Up to five different alert trigger levels with user configurable colours can be set up for a site in just a few seconds.
Network Health Alerting
To enable you to respond to issues in the system, WebMonitor can automatically send email notifications to any list of addresses if a device is no longer communicating with the system. It can also send notifications if a gateway’s battery voltage drops below a warning threshold to give time to respond before loss of service.
Custom Branding
WebMonitor can be custom-branded, from the login page through to the alert messages. This is achieved through tenant configuration options; no software development work required.
Screen Shots
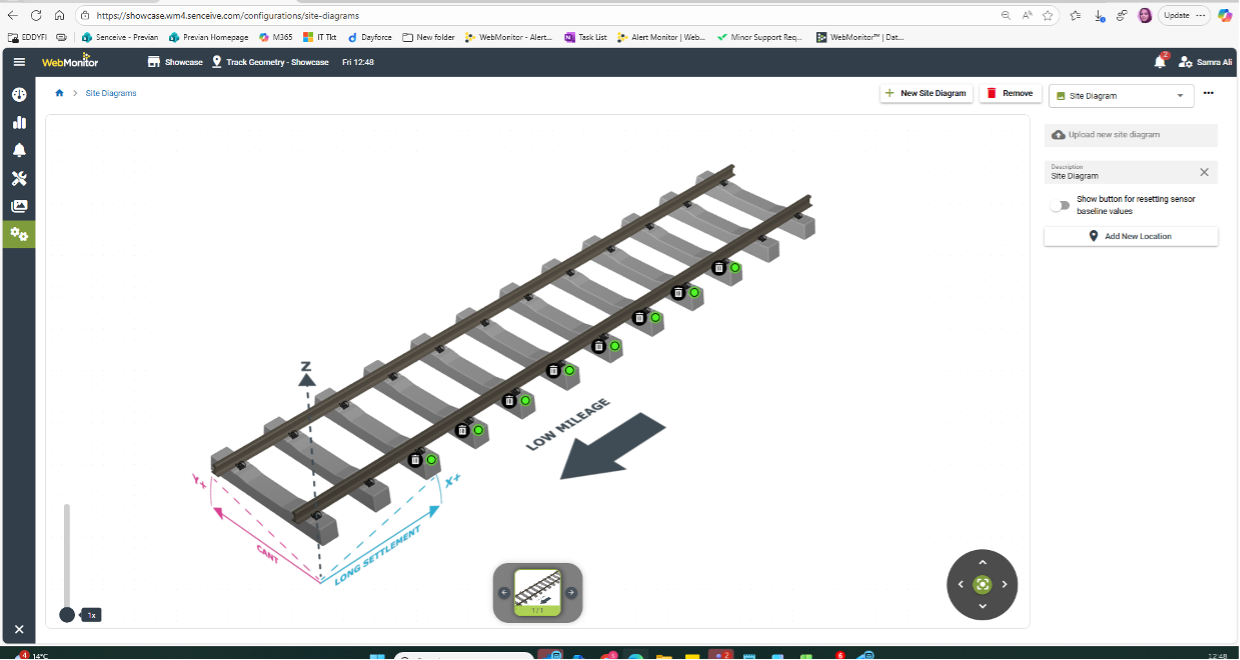
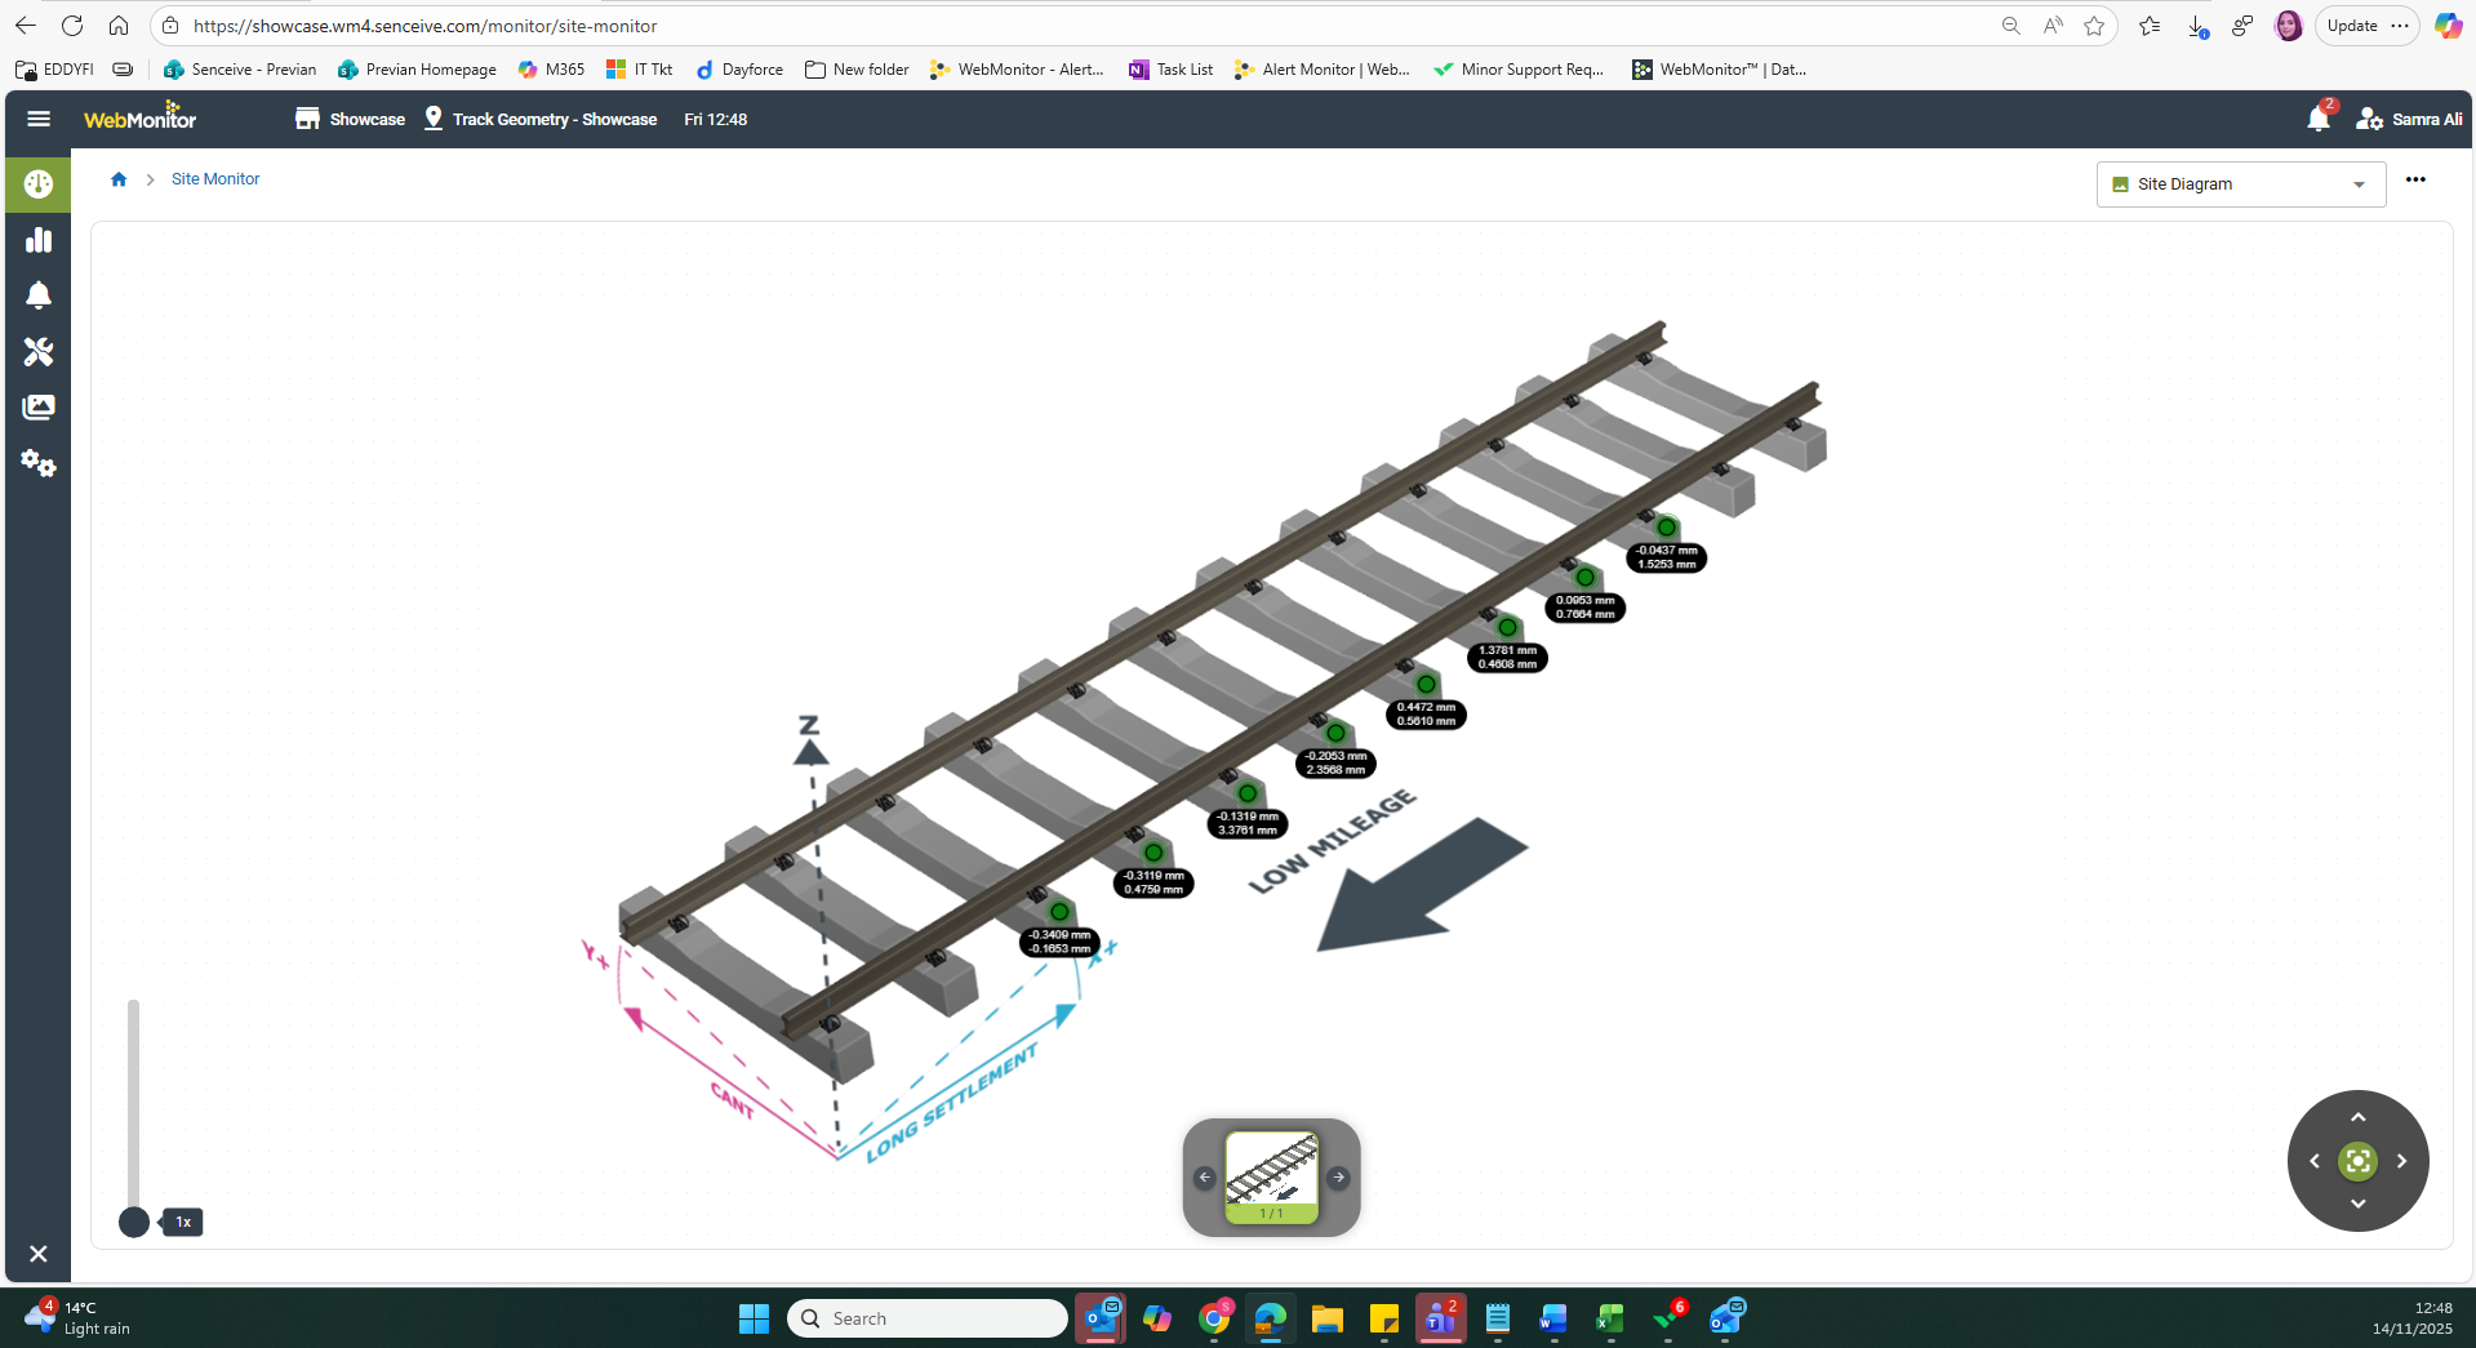
Site Monitor
The Site Monitor is customised with a graphic representing the site. This may be a map, technical drawing, or simply a photograph. Sensor icons are overlaid on this image and show the last reported value for that location along with its current alarm status (e.g. clear/green/amber/red for multi-level alarm triggers). Clicking the location icon allows quick direct access to graphs for that sensor.
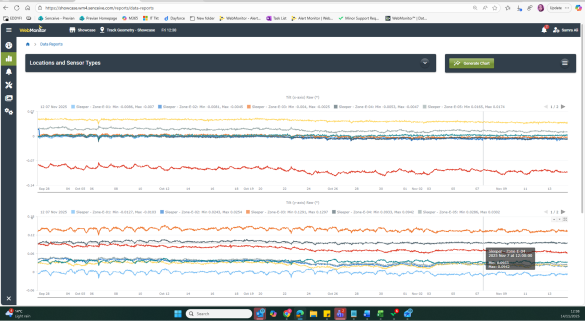
Data Reports
The Data Reports page allows the user to quickly generate time series graphs and downloadable CSV files for any combination of locations and sensor types. Graphs allow interactive zooming and quick data set selection for frustration-free data exploration. Alert trigger levels are shown as shaded backgrounds.

Sensor Chain Reports
The dedicated Sensor Chain Reports page is used to view data from sensor chain virtual sensors. Graphs allow interactive zooming. Alert trigger levels are shown as shaded backgrounds. Data can be exported to a downloadable CSV file with a single click.
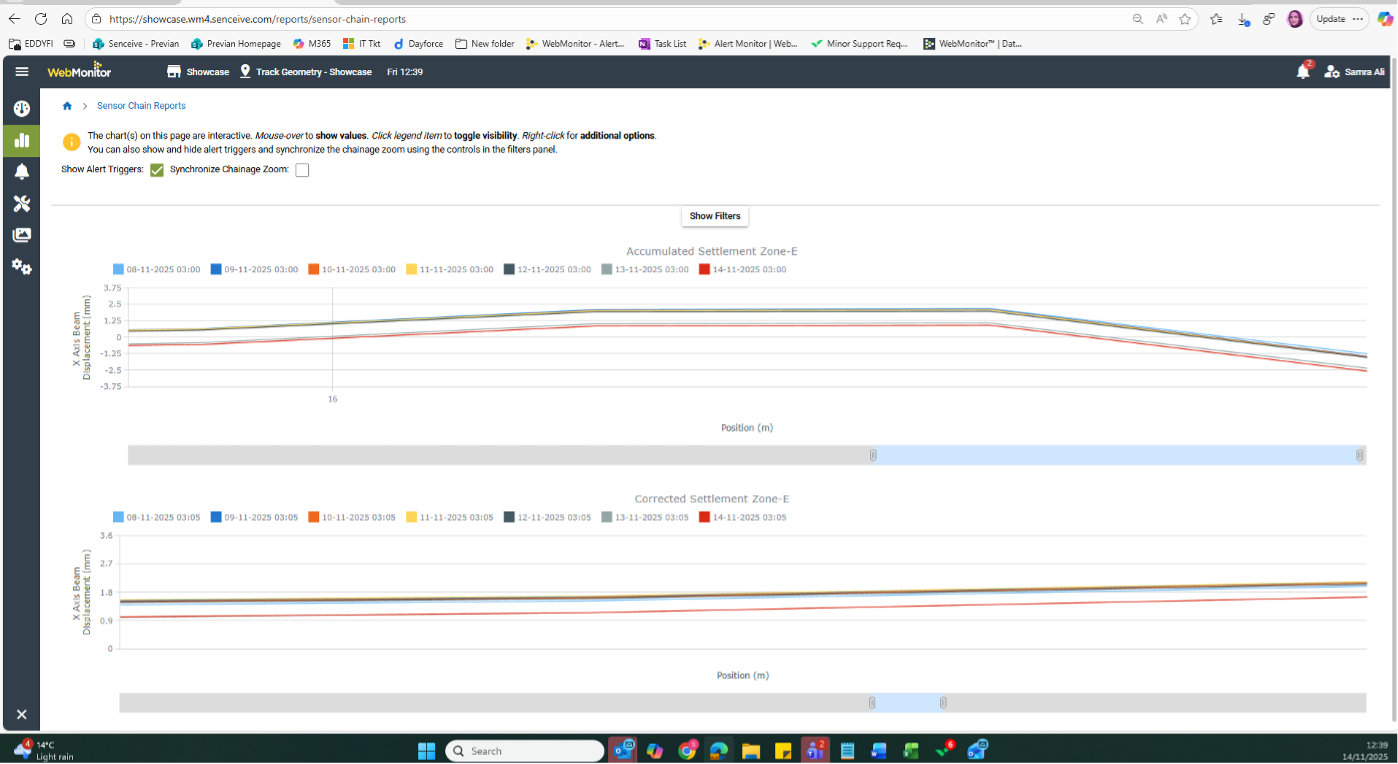
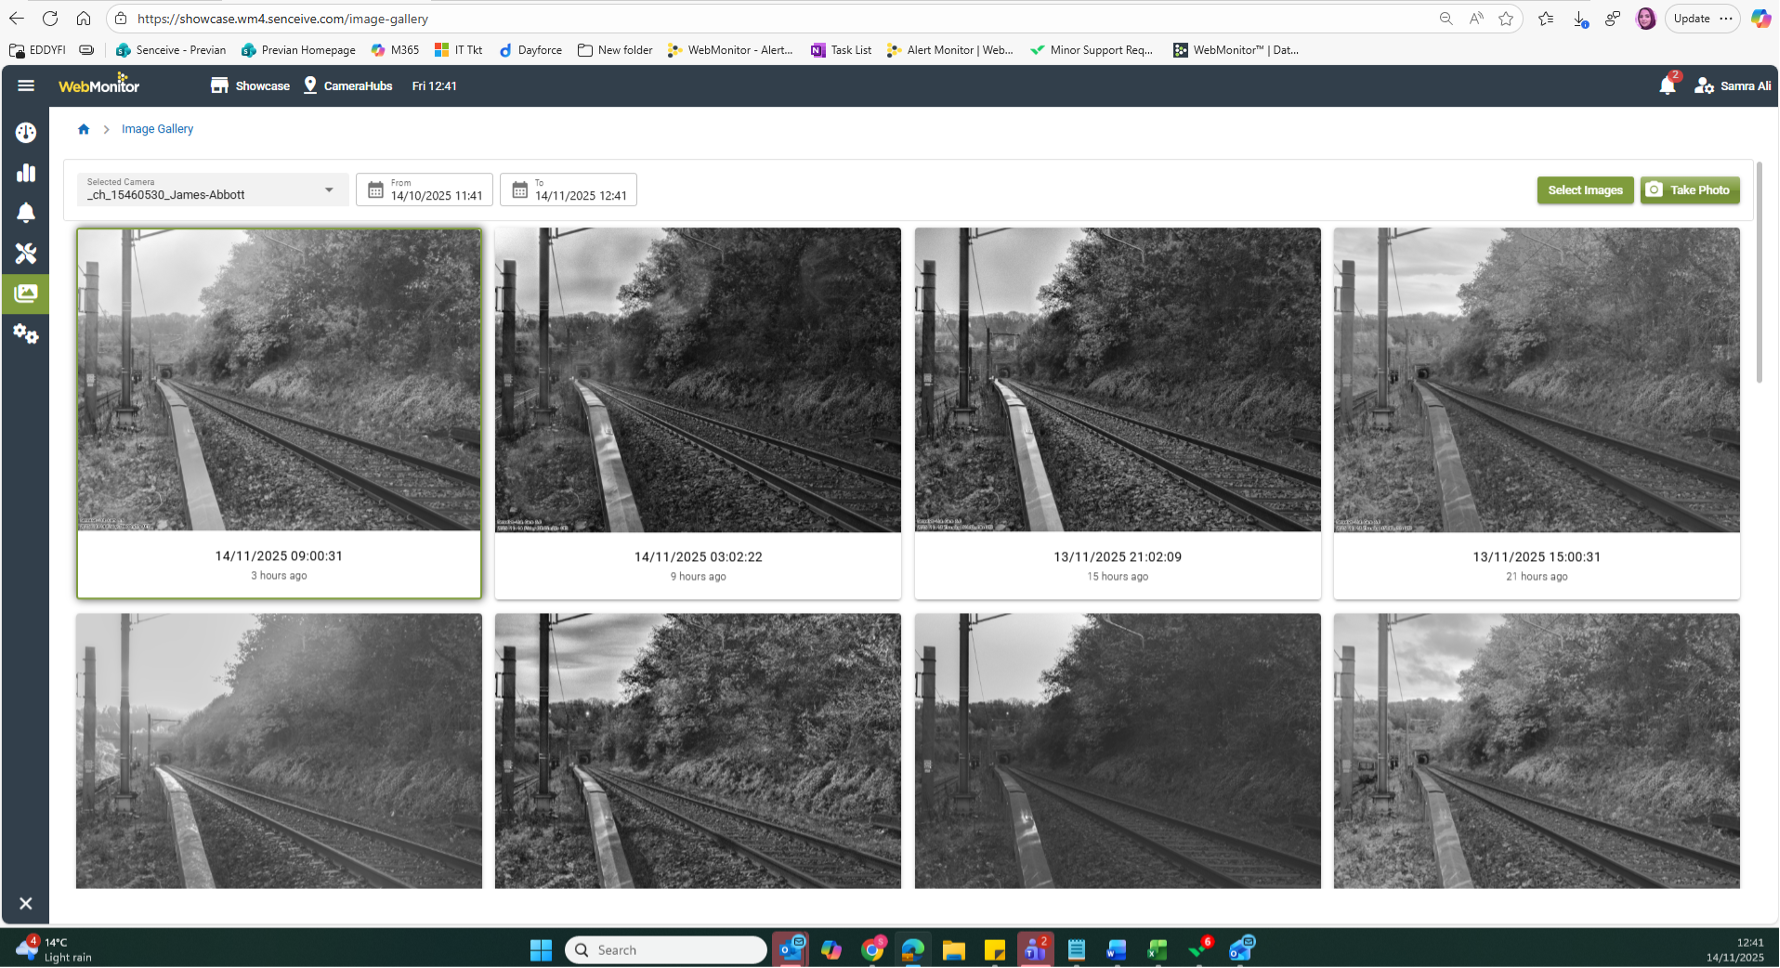
Image Gallery
Images from any cameras on the site will be shown on this page. Individual images can be viewed and downloaded. Data can be interpreted alongside site images. There is also an option to create GIFs.
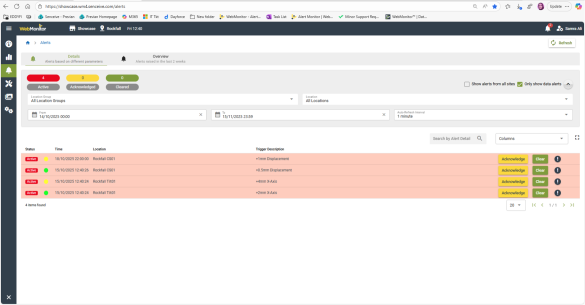
Alert History
The Alerts page shows the full history of active, acknowledged and cleared alerts for the site. Records of the user and time of acknowledgement and clearing are available for each record. The panel at the top of every page shows currently active alerts for all sites so you never miss a thing.

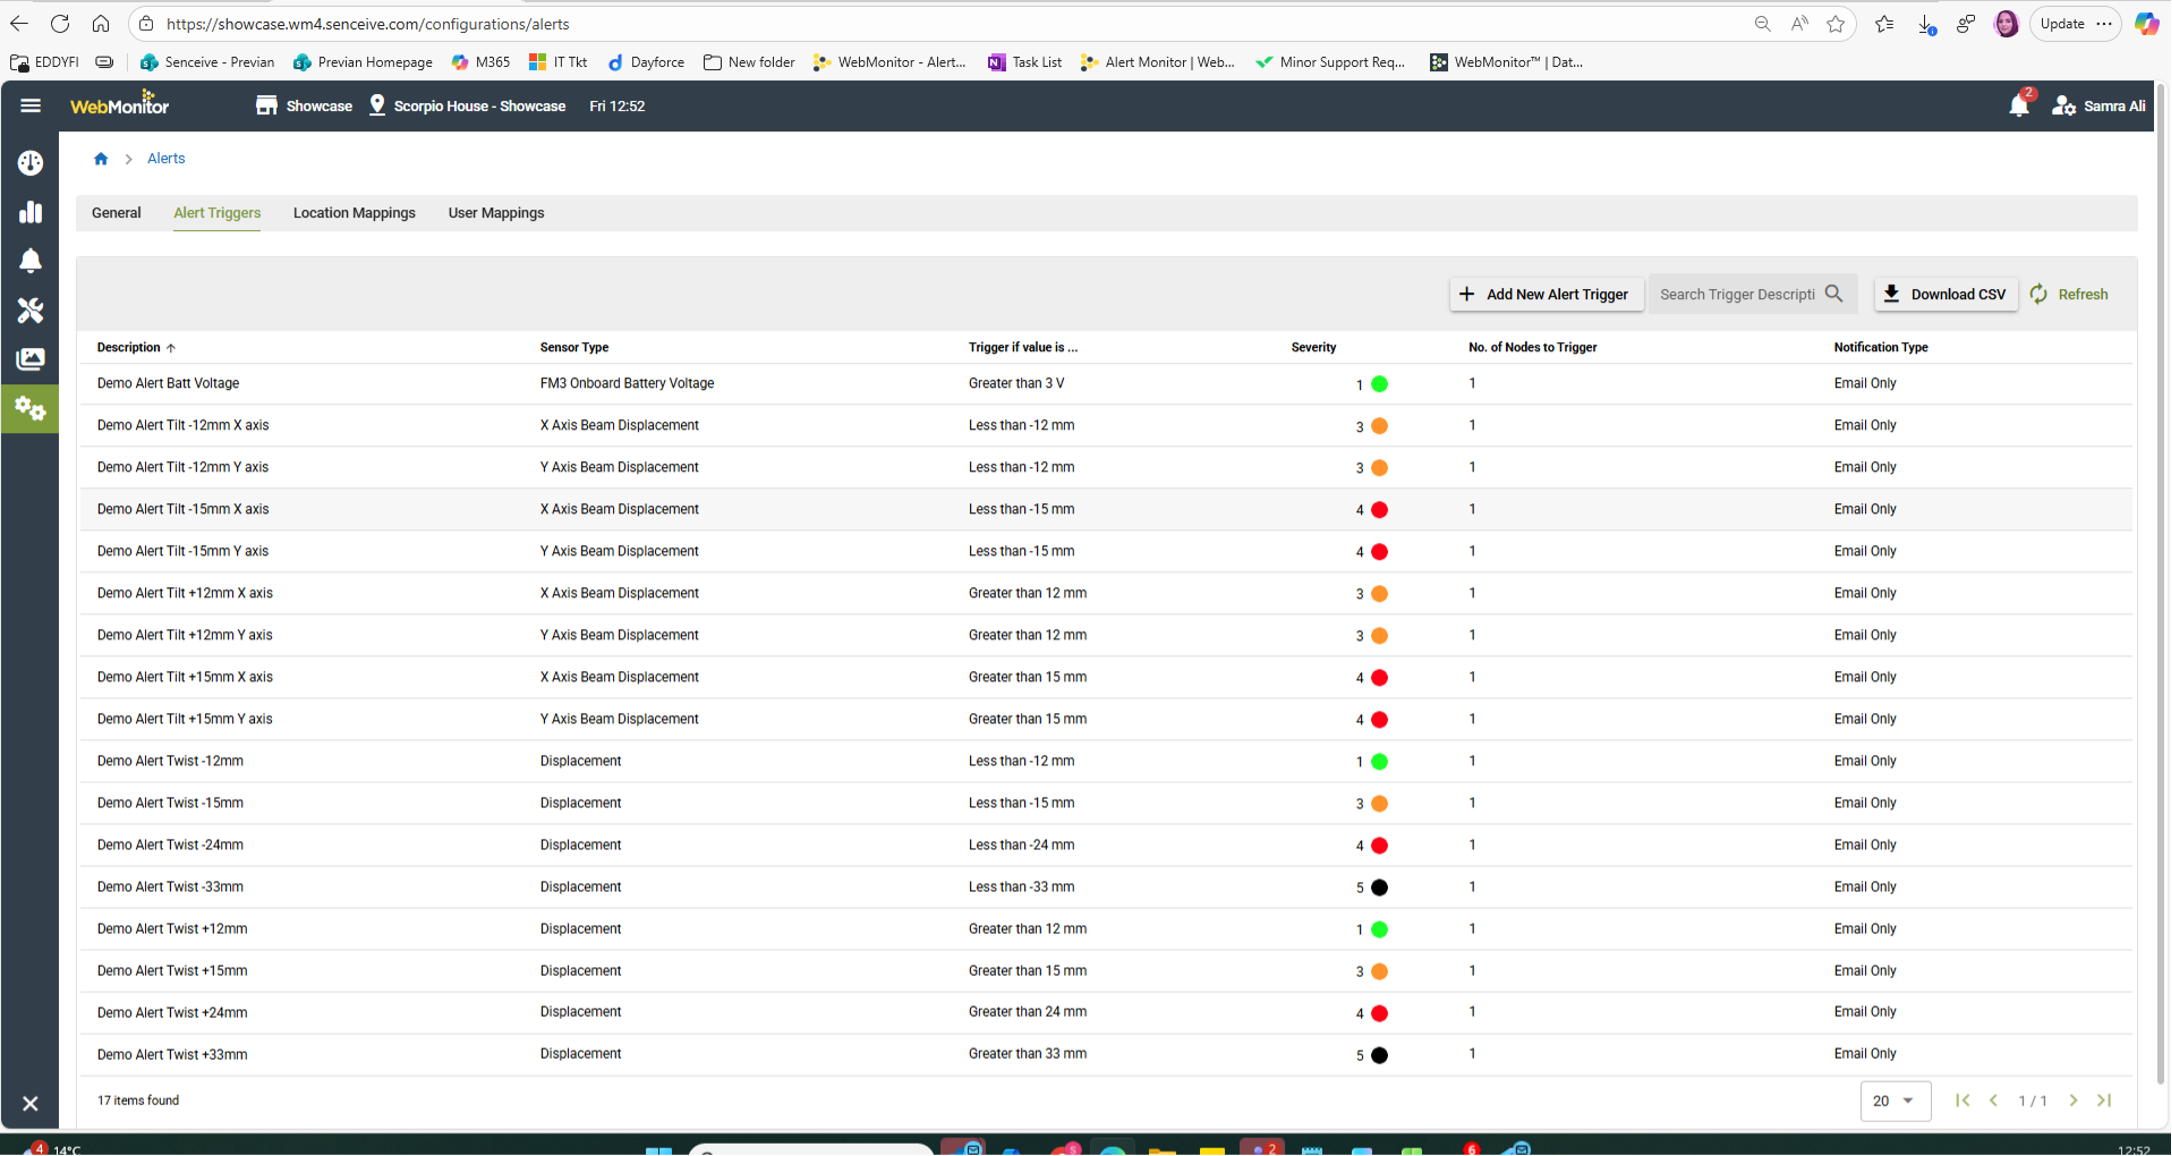
Configuration: Alerts
Alert Triggers are highly configurable, with the ability to configure complex alerting rules in a clear and straightforward way.
Configuration: Site Monitor
Site Monitor configuration is done using an easy to use drag and drop interface.