
Published Thu 25th May 2023
“Hope is not an engineering tool”. Quoting an unknown author summarizes the necessity of monitoring. While hope might be defined as a rough estimation of the absence of disturbing events, risk might be defined as the probability of an undesirable event due to activity or neglect.
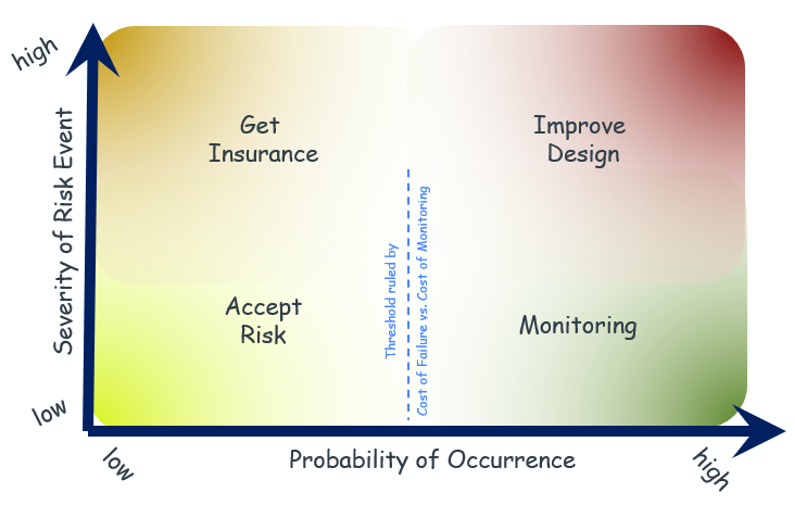
For a monitoring programme to enable a thorough evaluation of risk it should deliver data on parameters including threshold values, speed of occurrence and of course the severity of the event. Consideration of the latter in particular defines whether monitoring seems efficient compared to accepting the consequences of a failure. Those consequence could range from financial loss or project delay, to injury or loss of life. Whether investment in monitoring pays off will depend on the severity of the risk event balanced against the cost and effort required to implement the monitoring programme (Figure 1 above: Estimation of the Economic Efficiency of Monitoring). It is therefore important to seek ways to lower the cost and simplify the process.
Automation
Automation can be considered one of the main levers to control cost, particularly where frequent reporting is required, where access to the area of observation is limited, difficult or even dangerous, or where the observation is needed over a long duration. Key considerations are the level and predictability of running costs, the need for maintenance, and system reliability. Whereas manual surveys provide the opportunity to react spontaneously, automation requires a degree of foresight. It is also requires confidence that the automated system is sufficiently smart to monitor the health of itself and the assets it is observing. Only when that confidence exists can the user sleep tight with confidence that their virtual watchdog is keeping an eye open for them.
The first steps in this journey involved the automation of traditional (mostly optical) geodetic observation tools such as total stations. Advantages include the low cost of passive targets and the ability to translate one-dimensional coordinate differences to reveal absolute displacement in the three-dimensional space. Disadvantages include reliance on line-of-sight to reflective prisms which can be obstructed in the short or long-term by construction machinery, dust, snow or condensation (see example Figure 2). Prisms and other equipment such as cables required for communication or power supply could be damaged or destroyed by construction activity. A further constraint is that systems reliant on passive sensors provide data only at the predetermined time at which a measurement is taken – they are unable to react to changing conditions, for example by accelerating their sampling regime. Many of these shortcomings can be overcome by the use of active optical and mechanical sensors using wireless technology.
Figure 2: View from Automated Total Station onto a Construction Site

Wireless Techniques
Alternatives came into sight with miniaturisation, specifically the advent of Micro-Electro-Mechanical Systems (MEMS) techniques. The availability of very small sensor components with low power consumption has allowed the combination of sensor, communication and power supply in a single compact housing, referred to as a Node. The node is self-sustaining and autonomous and as such forms the primary component of a Wireless Condition Monitoring (WCM) system.
A notable example of the fully integrated sensor species is the tilt node. With 3-Axes inclinometers providing 360° measurement range the user can choose to deploy the node at any orientation with no need for pre-levelling. Very low power consumption (more than 12 years @ 30min recording interval) enables long-term structural health monitoring and efficient measurement in locations that are hard to reach. It also enables re-use of sensors on multiple projects. Wireless nodes can transmit data from their own built-in sensors (e.g. triaxial tilt meters), and can also be connected to various external sensors. Conventional geotechnical devices, such as potentiometric crack sensors or vibrating wire strain gauges or piezometers from various manufacturers can be combined to form a multi-sensor system reporting within one platform. Fig.3 shows an example for monitoring of a historic facade utilising various sensors including tilt nodes and crack sensors connected to a single wireless communication platform. Alternatively, a cluster of identical sensors can be connected to a multi-channel communication node (Fig.4)
Left: Figure 3: Historic facade monitoring by tiltmeter and crack sensor; Right: Figure 4: Strain gauges connected to multi-channel wireless node mounted to a concrete bridge beam


Where distances exceed the range of mechanical devices like the above potentiometric or draw wire sensors, or where the location does not allow a physical connection, integrated laser distance sensors can help to detect 1D displacements (Figure 5).
Left: Figure 5: Optical Displacement Sensor incorporating tiltmeter and laser distance sensor; Right: Figure 6: Solar powered cellular gateway


A gateway device gathers the data, stores it and in most cases transmits it via cellular modem to a cloud-based data visualisation platform (Figure 6). In most cases the gateway is solar-powered, thus enabling the use of wireless monitoring at locations that have neither fixed power or communications infrastructure
The two most widely used communications platforms are a high frequency mesh based platform using the 2.4GHz Wi Fi frequency, and a lower frequency point-to-point LoRaWAN system operating at 868MHz . The longer wavelength of the latter system provides long-range transmission directly from the node to the gateway over distances of several kilometres and penetration through physical obstacles. Pay offs include issues related to legal limitations of signal occupation and constraints in recording rate and two-way communication due to the low bandwidth. Furthermore, LoRa users occasionally experience overlapping by ambient signals and thus must accept a certain amount of so-called package loss.
With its shorter wavelength, the 2.4GHz provides a much higher bandwidth, albeit at the expense of reduced range, which is limited to a few hundred metres under best conditions, and more typically to a few tens of metres. Wide areas can still be covered however because nodes can be configured to form extended clusters. Significant advantages of platforms such as Senceive FlatMesh™ include faster (subminute) reporting rates and much greater interaction with the monitoring system by remote users.
The other key element of a wireless monitoring system is usually a cloud-based data portal and visualisation platform that provides user access, preliminary data processing and alarming based on user-defined threshold values.
Read more about examples and evaluation: Wireless Condition Monitoring: Examples and Evaluation | Senceive